
Business Intelligence for Restaurants with Amazon Quick Sight
Growing restaurant groups end up running more than one point of sale, and no POS ships the KPIs a 100-location group actually runs on. We build the restaurant BI tool for chains on AWS: every location consolidated into one Data Warehouse, with the dashboards built around the numbers your operation lives by.
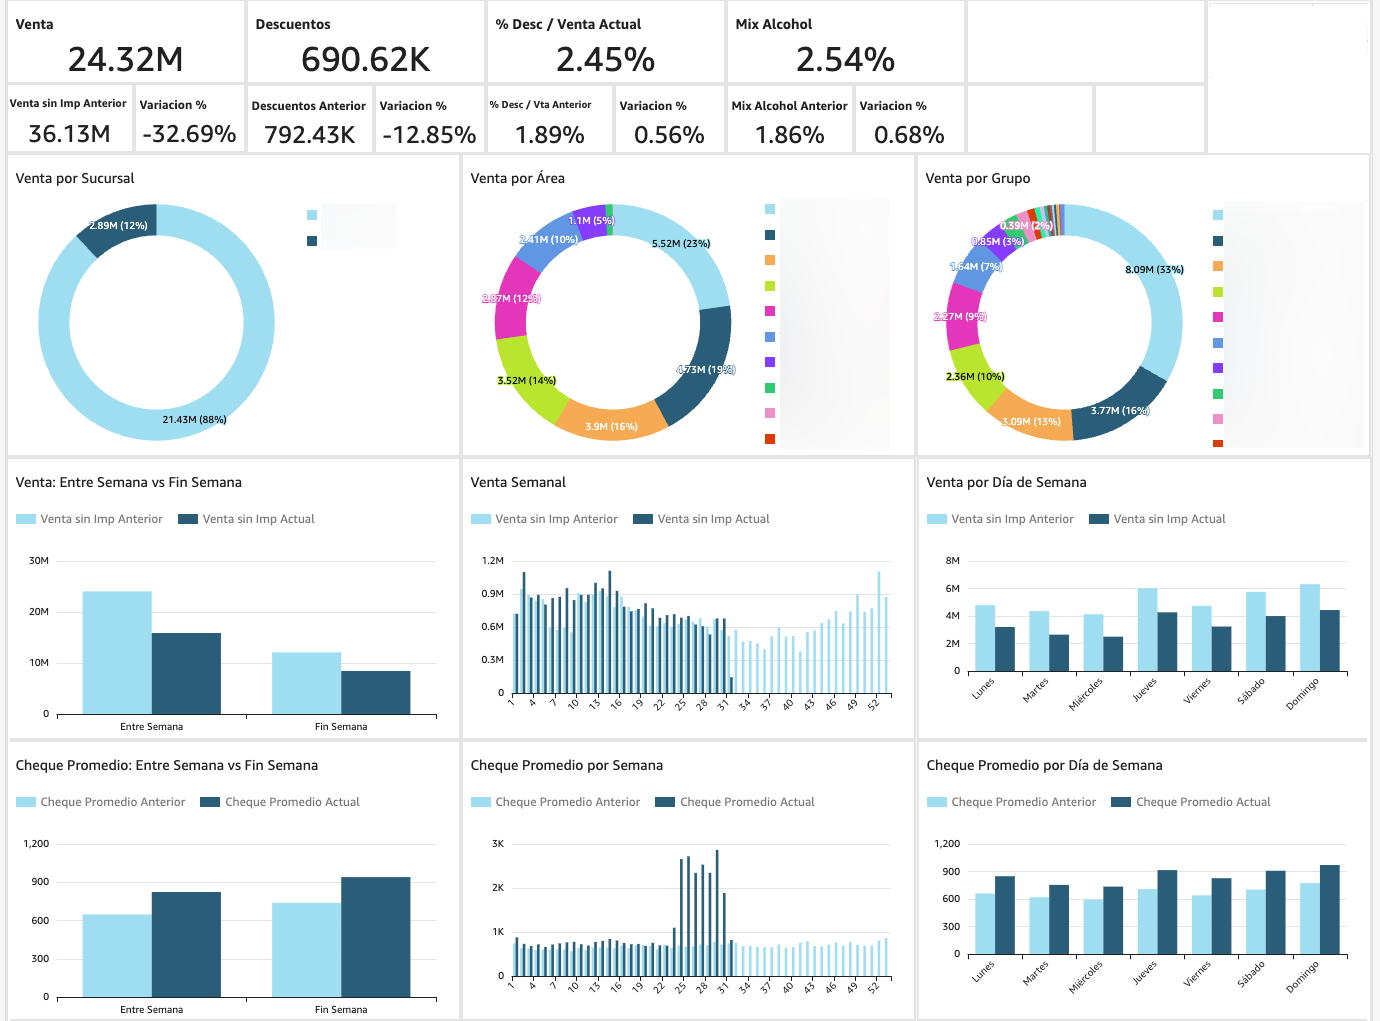
What this dashboard solves
A restaurant group rarely stays on one system. You acquire a brand that runs something else, you open a franchise with a different vendor, or you move your newest stores to a modern POS and leave the rest on the old one. Each system keeps its data in its own place, with its own structure, and none of them was built to answer a question across the whole group.
Vansync, our own ETL, reads every location at the source and lands it in a Data Warehouse on AWS. That warehouse is the base of the restaurant business intelligence your leadership reads in Amazon Quick Sight. Nobody replaces a point of sale, and nobody keys anything in twice.
No POS delivers the KPIs and analytics your restaurant chain runs on
Every group tracks same-store sales, and your point of sale will give you that. What it will not tell you is what share of a tab your star dish carries, or how your alcohol moves once takeout is taken out. A group going from 10 to 100 locations starts asking questions its point of sale was never built to answer, whatever its name and whatever it costs. For one of our clients the number that matters most is this one, because a delivery ticket and a table ticket are two different businesses and averaging them hides both.
alcohol / tab sales, takeout excludedMost groups reach us with operational reporting already in place, and a team keeping it alive. It worked at 20 locations. At 80 it does not: the report that used to run before breakfast now takes hours to export, and every new question turns into a ticket that takes weeks, sometimes months. So somebody ends up exporting to Excel to get an answer before the next meeting starts.
The systems we read
We read your data at two levels: the API, when your systems have one, and the database engine underneath, when they do not. That is what lets us work with a point of sale we have never seen before, and it is what makes a restaurant BI tool for chains on AWS work across a group that runs more than one.
The list grows with every project, because what decides the job is the engine or the API, not the brand on the terminal.
What this dashboard includes
Every line below started as a C-level question, most of them from one 150-location restaurant group that had been running the whole group on spreadsheets and nightly closing messages. Together they make up the restaurant sales dashboard the group works from. It is a starting point, not a fixed menu.
Same-store sales (SSS) and company-wide sales, with MTD and YTD comparisons
Sales adjustments, discounts and voids by manager and by location
Sales by area (dining room, lounge, patio, catering)
Sales by day-of-week, time-of-day, region and city tier
Menu mix and product performance: LTOs, top vs. bottom items, dine-in vs. takeout
Guest ratings and internal audit scores by location, next to the sales numbers
Three chains we run today
Three real restaurant chains, anonymized at the name only, all three running their business intelligence on AWS today. The store counts, the systems and the database engines are exactly as they run.
They wanted modern business intelligence for restaurants and had no clear path to connect it to a legacy database that was already too big and too slow to pull reports from.
What we didOur solution was to read the point of sale at the source with Vansync and take the reporting load off it, paired with consulting to define the KPI set the group actually manages by. When they started moving stores to a modern POS, we connected that one through its API instead of its database, so both feed the same warehouse and the chain keeps one continuous history across the switch. Then we added their Google Maps ratings and their internal audit scores, so the operating numbers and the guest's opinion finally sit on the same page.
250 locations, each with its own on-premise database, and not all of them running the same POS version. Every release had added columns the previous one did not have, so store by store the databases did not even have the same shape.
What we didOur solution was to synchronize all 250 on-premise databases at the source, three times a day, with Vansync, paired with consulting to build the warehouse on the newest schema and keep every column any version had ever added. Old and new releases now live together in one model: a store still running an older version lands in the same tables as the newest one, and nobody had to upgrade 250 installations to get there. Their store and item catalogs are enriched from spreadsheets the team maintains itself, including a mapping of POS keys into SAP.
One restaurant group, two franchise brands, two different points of sale on two different database engines, and no company-wide view to compare one venue against the rest.
What we didOur solution was to pull both systems at the source into a single warehouse, paired with consulting to agree on metrics that hold across both brands. That is where Alcohol Mix came from: the share of alcohol in tab sales with takeout excluded, which is the number this group manages by and the kind of number no POS ships on its own.
From your POS to Amazon Quick Sight
Extract
We connect to each location's database, or to your POS API, with our Vansync ETL. No disruption to your operation and no change to your staff's daily workflow.
Model
We store every transaction that matters in a Data Warehouse on AWS and model it around the KPIs your group manages by, not the ones your point of sale happens to ship.
Visualize
We build the restaurant dashboards and analytics in Amazon Quick Sight, ready for your leadership team to move from insight to action.
Open the restaurant dashboard now
This is a live Restaurants dashboard running on Amazon Quick Sight, not a screenshot. No form and no sales call: copy the credentials and it opens in a new window.
Read-only account · opens in a new window
Works with any POS: connected and tailored to your needs.