
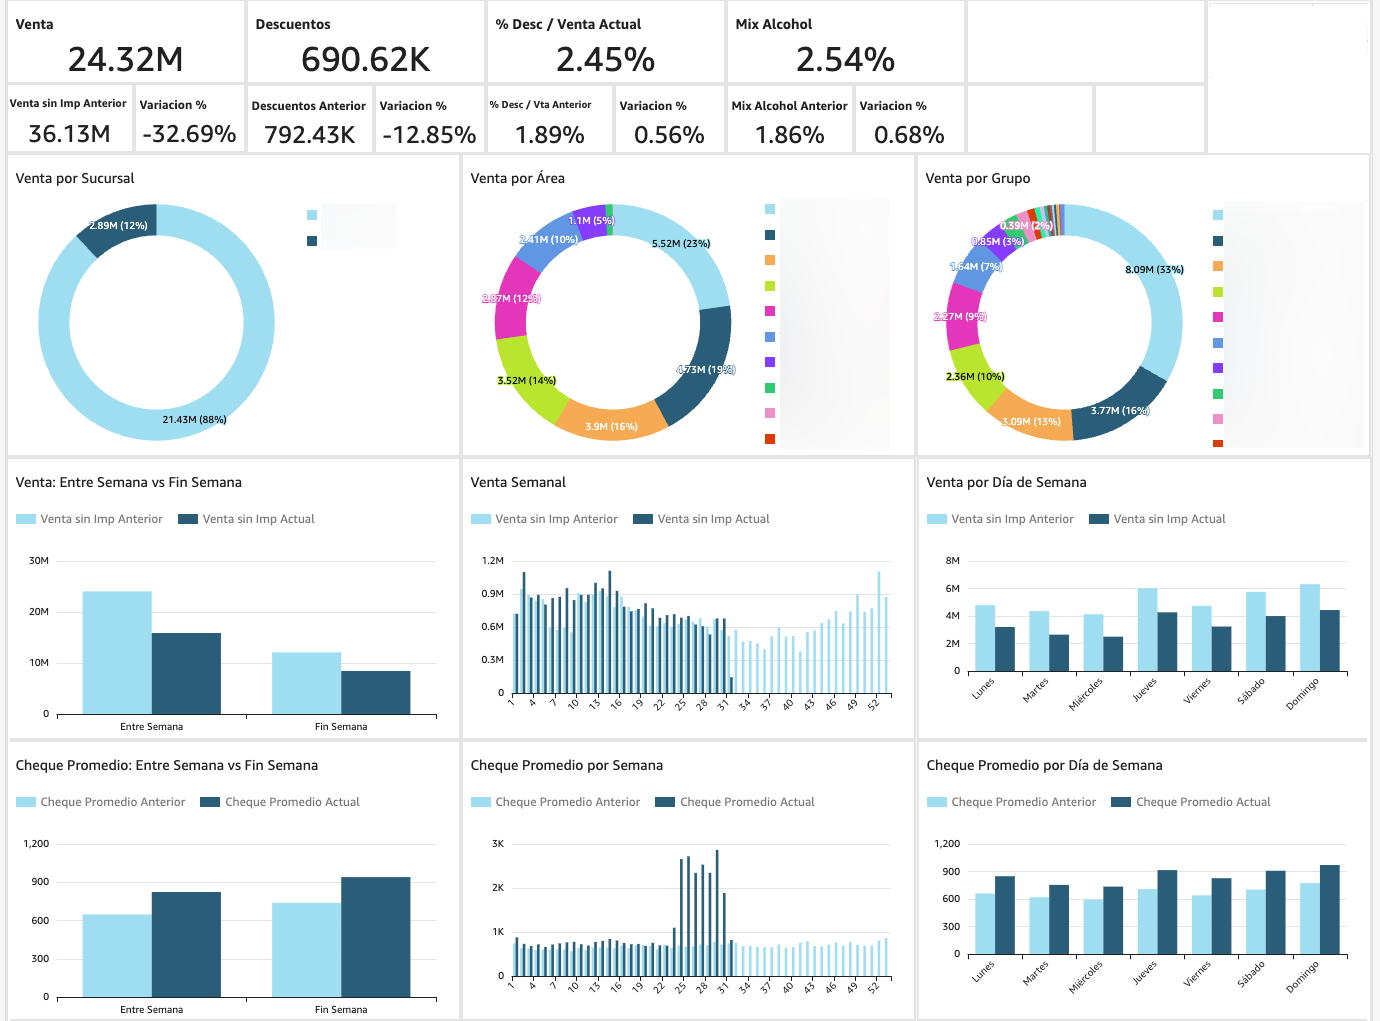
Restaurant dashboard for POSitouch
For chains running POSitouch, growth comes in two flavors: same-store sales (SSS), the comparable performance of locations open in both periods, and company-wide sales that include new-store contribution. This dashboard separates the two so you see organic growth and expansion impact clearly. Monitor manager discounts and voids before they spike, drill into menu mix (LTOs, top vs. bottom items, dine-in vs. takeout), and analyze sales by area, day-of-week, time-of-day, region and city tier. Annotate each store with the events that explain the swings: weather, road closures, New Store Openings (NSOs), local marketing campaigns.
- Same-store sales (SSS) and company-wide sales, with MTD and YTD comparisons
- Sales adjustments, discounts and voids by manager and by location
- Sales by area (dining room, lounge, patio, catering)
- Sales by day-of-week, time-of-day, region and city tier
- Menu mix and product performance: LTOs, top vs. bottom items, dine-in vs. takeout
From POSitouch to your dashboard, in clear steps
Extract
We connect to your POSitouch database with our Vansync ETL. No disruption to your operation or daily workflows.
Model
We replicate data to Amazon AWS and model it so your leadership sees it live, not for data entry.
Visualize
We build the dashboard in Amazon QuickSight, ready for you and your leadership on web and mobile.